恭喜你,来到了我们的result页面,我们很快就能看到我们的match分数啦~是不是很期待?
我们先来公布一份超级有爱的match结果~
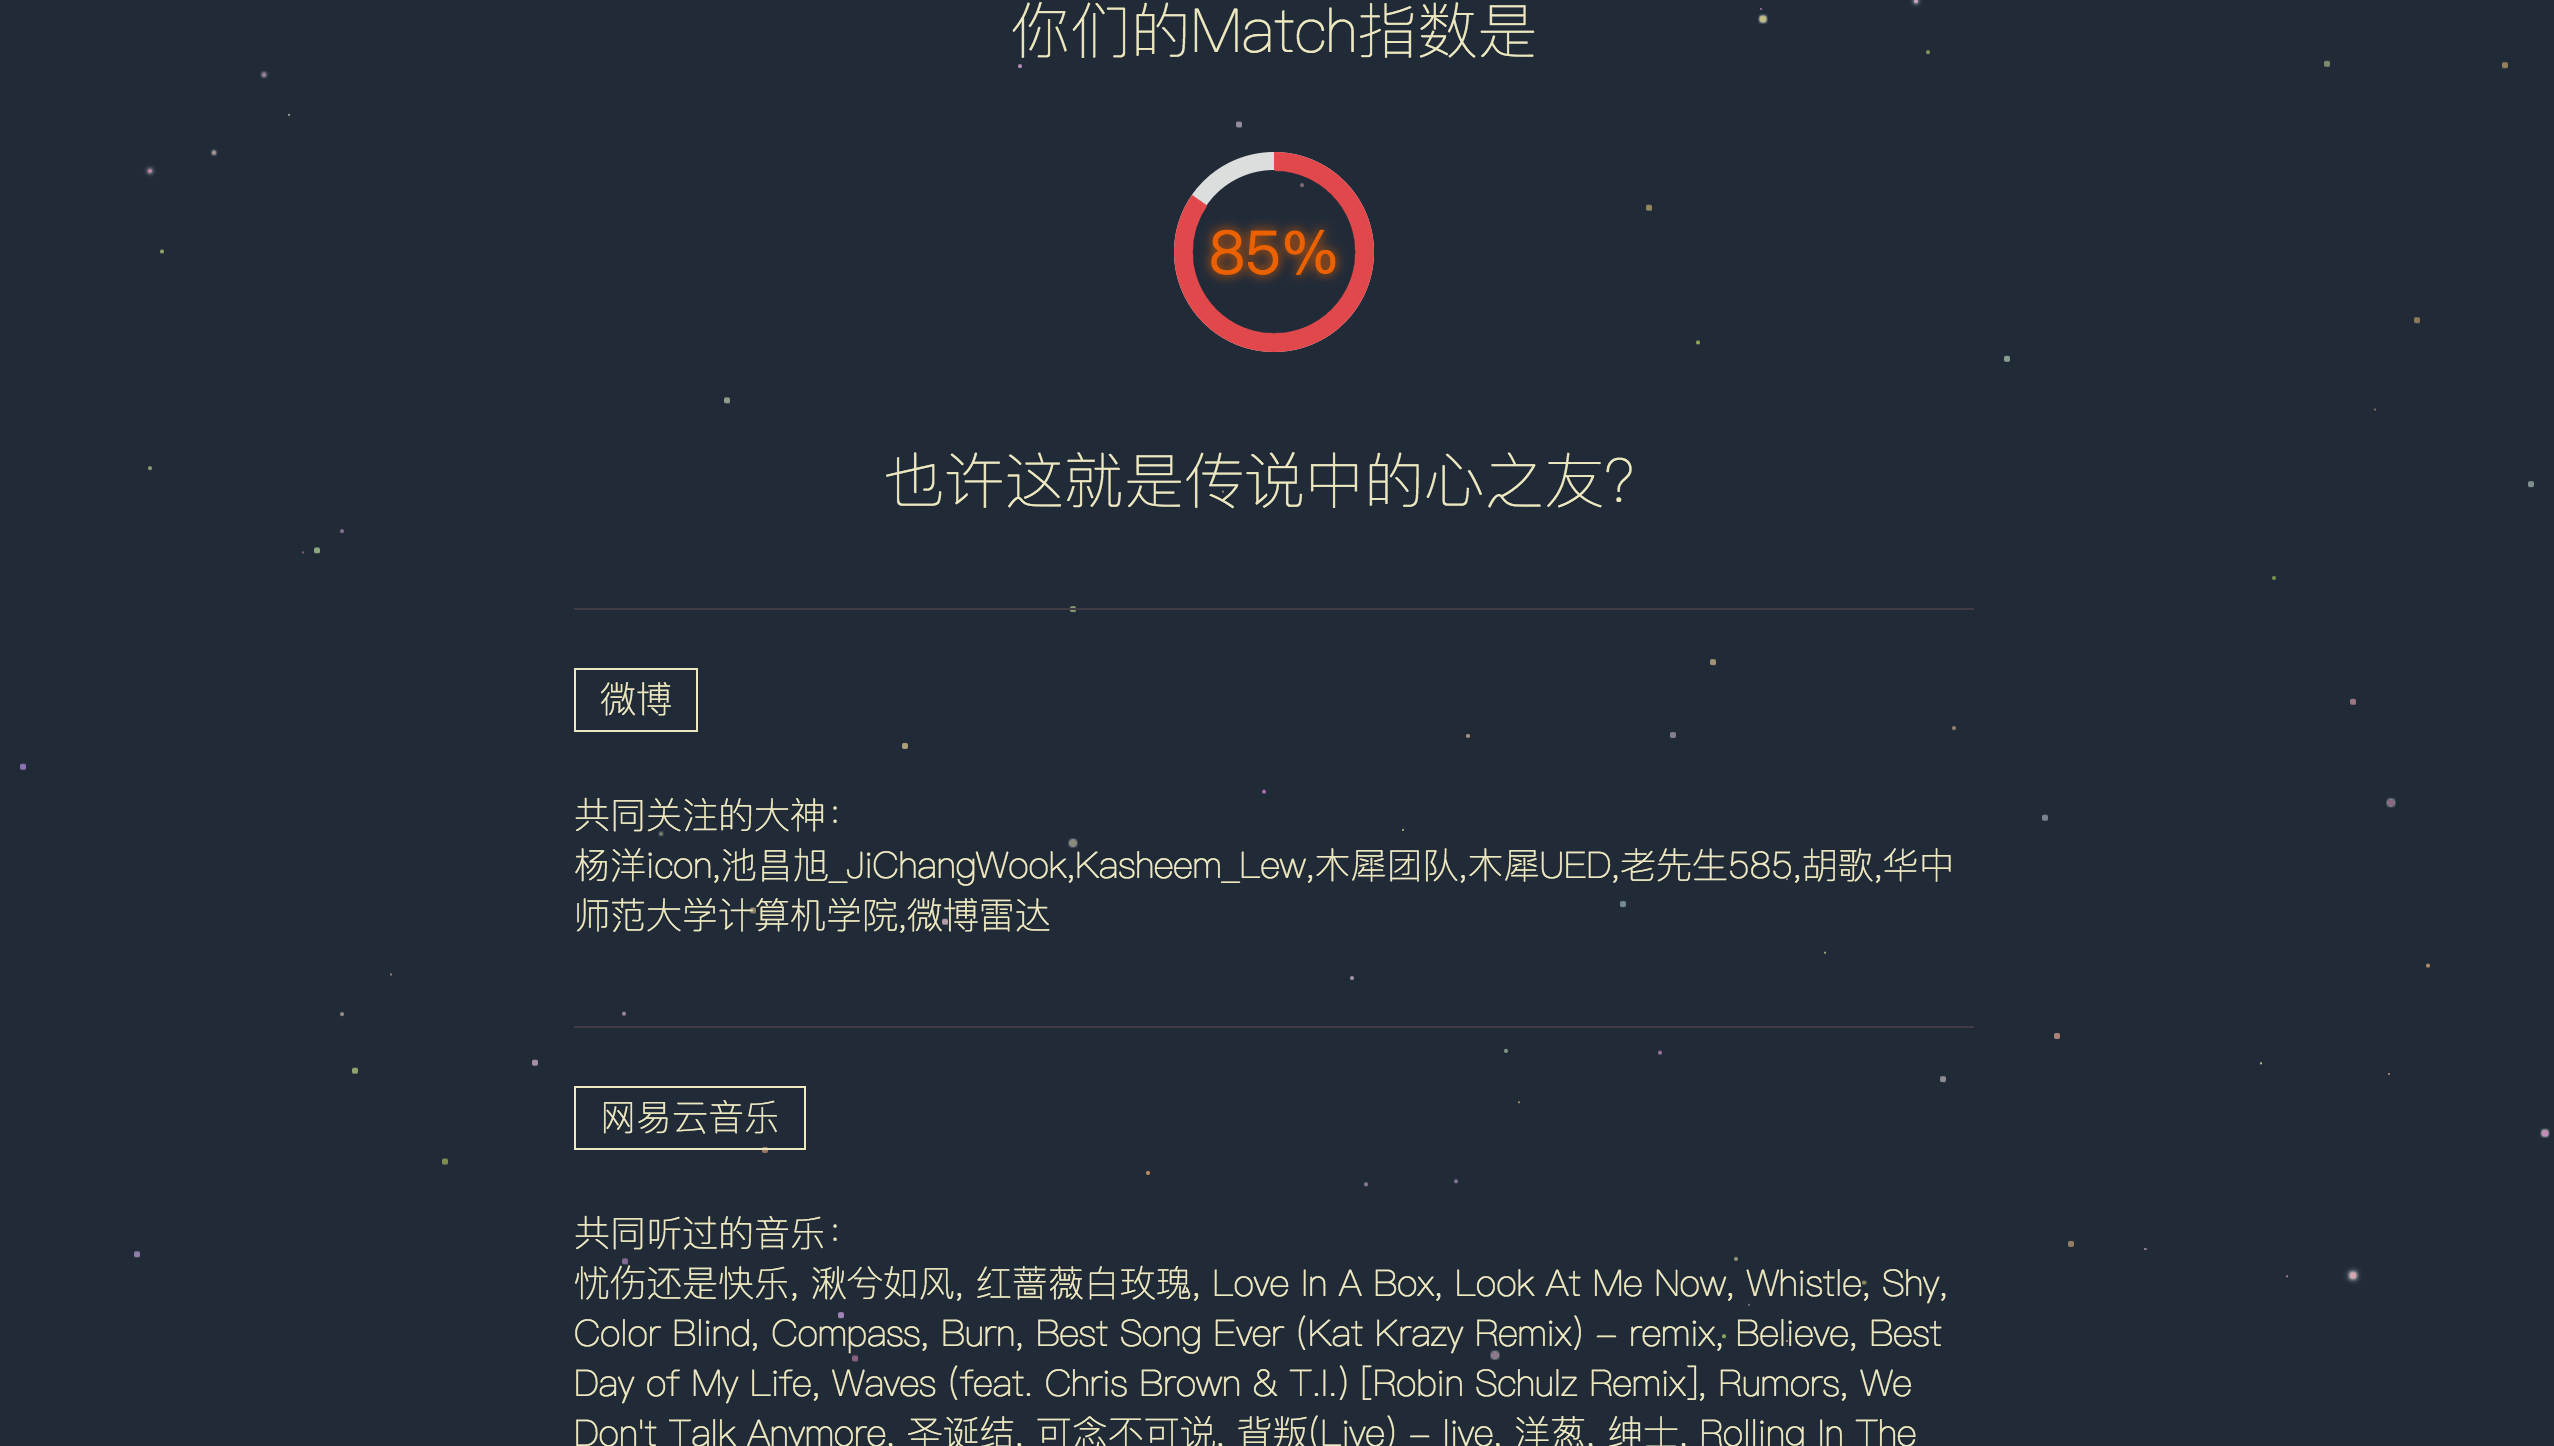
大家可以看到我们的页面上有显示相对应应用中的共同项
这里我决定只显示有共同项的应用版块,这里采用的方法是在判断每一个版块上所返回的字符串是否为空,代码如下,若info.douban.book为空,则v-show=“false”,该板块就不会显示
<div class="common" v-show = "info.douban.book">
          <div class="common_t">共同看过的小说:</div>
          <div class="common_t">
            {{info.douban.book}}
          </div>
        </div>
      </div>
好的,接下来就是我们显示match指数的的百分比图了,动态效果请戳piechart
<template>
        ...
    <svg viewBox = "0 0 32 32">
    <circle class="circle" r = "16" cx = "16" cy ="16" v-bind:style = "{strokeDasharray:Math.floor(score) + ' 100'}"></circle>
    </svg>
        ...
 </template>

<style>
        ...
      svg{
        width: 100px;
        height: 100px;
        transform: rotate(-90deg);
        border-radius: 50%;
      }
      .circle{
        fill:transparent;
        stroke:#e1484b;
        stroke-width:6px;
        animation: fillup 1s ease-out forwards;
      }
      @keyframes fillup{
        from{stroke-dasharray: 0 100;}
      }
        ...
</style>
我们将采用svg标签来画这个百分比图,用stroke属性来实现动态变化效果
svg的viewBox顾名思义就是视区盒子的意思,它覆盖整个svg图,我们在style中定义svg是一个半径为50px的圆,那么viewBox = “0 0 32 32”只是内部将此圆的半径长分为32份,而circle中的r代表此圆的半径,相对于viewBox而言的16,既是整个svg图的一半,cx,cy是其圆心坐标,处于svg图的正中心。
接下来看它的动态效果如何实现,这里我们仍然需要用svg的stroke属性,stroke会沿着svg图像(此处为一个半径为50的圆)的边界划出一条线,我们再用animation属性使其产生变化的效果。这样一个piechart就完成啦
好啦,你还等什么,赶紧去寻找你和你的TA的相同点吧~